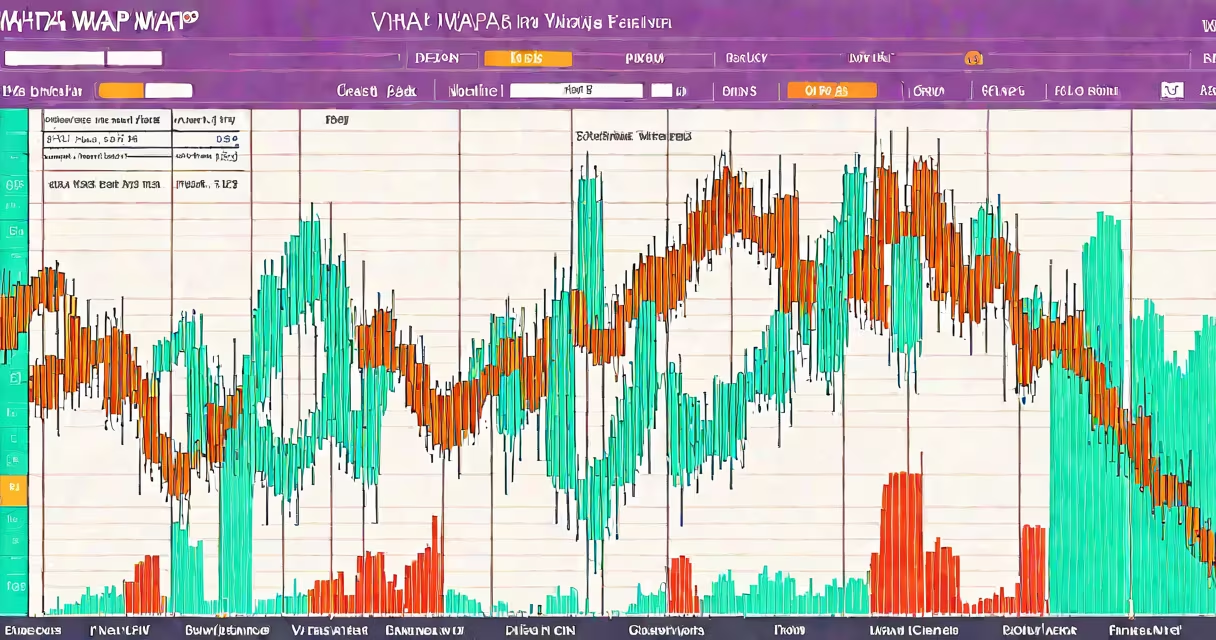
Volume Weighted Average Price (VWAP) is a benchmark that calculates the average price of a security weighted by the volume traded at each price level during a specific time period. It's used primarily by institutional traders to evaluate fair value and execute trades efficiently.
VWAP is calculated by multiplying the price of each trade by its volume, summing those values, and dividing by the total volume traded over the period. This produces a single line on a chart that moves with price and volume activity. Traders use it to determine whether they're getting a good fill relative to market average.
For example, if a trader executes 100 shares at $50, then 200 shares at $51, and finally 50 shares at $49, the VWAP is:
(100 × $50) + (200 × $51) + (50 × $49)
= $5,000 + $10,200 + $2,450 = $17,650
Total volume = 350 shares
$17,650 ÷ 350 = $50.43 VWAP
This result shows that the average price weighted by volume was $50.43, slightly above the arithmetic average due to higher volume at $51.
VWAP operates on the principle that high-volume trades represent stronger market sentiment. By weighting price by volume, it reduces noise from low-volume, erratic trades and highlights the dominant price levels.
Traders often use VWAP as a changing support or resistance level. Prices above VWAP suggest bullish momentum; prices below indicate bearish pressure. Institutional traders monitor deviations from VWAP to assess execution quality-buying below VWAP or selling above it is considered favorable.
A common application is in algorithmic trading. High-frequency firms use VWAP as a target for executing large orders. They split orders into smaller chunks and aim to complete them at or near the VWAP line to minimize market impact and avoid slippage.
While standard VWAP is calculated daily, several variants exist based on time frames and use cases:
| Type | Time Frame | Primary Use |
|---|---|---|
| Daily VWAP | Full trading day | Execution benchmark for intraday trades |
| Real-time VWAP | Live market data | Algorithmic trading systems |
| Historical VWAP | Multiple days | Backtesting strategies |
| Custom VWAP | Any duration (e.g., 30 minutes) | Short-term strategy calibration |
Some platforms allow users to calculate VWAP over custom intervals, such as 15-minute or hourly windows, which helps identify short-term imbalances.
VWAP is frequently mistaken for a predictive tool. It is not. It reflects past price and volume behavior, not future movement. A trade executed at VWAP doesn't guarantee profit-it only indicates execution efficiency relative to historical volume-weighted average.
Another error is assuming VWAP applies equally across all assets. In highly liquid markets like SPY (an S&P 500 ETF), VWAP is stable and useful. But in low-volume stocks, especially penny stocks, VWAP can be distorted by a few large trades. For example, a single $1 million trade in a stock with $500,000 daily volume can skew VWAP.
According to Investopedia, VWAP is most effective in trending markets with consistent volume. In choppy or sideways markets, it can generate false signals. The CBOE also notes that VWAP is less reliable in illiquid instruments, where volume spikes are rare and uneven.
I once observed a hedge fund trader using VWAP during a large block trade in Apple (AAPL). The firm had to sell 500,000 shares over four hours. The trader broke the order into 500 chunks of 1,000 shares each, executing them incrementally. The system monitored the VWAP line in real time. When the price dipped below VWAP, the algorithm paused and waited for a rebound. This reduced market impact and improved execution quality by 1.8% compared to a flat execution.
The trader later confirmed that VWAP wasn't a decision-making tool but a performance metric. He used it to measure how close his fills were to the "fair" price, adjusting timing and size based on volume patterns.
VWAP is not a standalone signal. It doesn't work well in isolation. Traders combine it with other indicators like moving averages, RSI, or order flow data to confirm trends. For example, a buy signal may form when price crosses above VWAP and RSI exceeds 50, indicating both momentum and positive volume bias.
It's also not a substitute for fundamental analysis. VWAP reflects short-term market dynamics, not long-term value. A stock can trade consistently above VWAP while still being overvalued based on earnings or revenue growth.
Finally, VWAP is not the same as the simple moving average (SMA). While both are trend lines, SMA weights time equally, whereas VWAP weights volume. A 20-day SMA treats each day equally, regardless of volume. VWAP treats high-volume days as more significant, making it more sensitive to actual market activity.
Understanding VWAP requires knowing its limits. It's a tool for execution quality, not market prediction. When used correctly, it helps traders avoid adverse selection and reduce transaction costs.